This graph shows the gauge height (measured or calculated by the U.S. Geological Survey) for the Minnesota River at Mankato during the high water period this spring. You can see that the MN River was above flood stage at Mankato from late 18 March through late 28 March. MN Highway 22 remained open through this period but MN 99, the road that crosses the river close to the Whiskey River Restaurant, was closed at the bridge for a while. Water never covered the highway but came very close to the structural beams under the road that support the bridge so MNDOT decided it was best to close the bridge. MN 99 has reopened now, of course.
March was warmer than usual this spring so the serious snowmelt period occurred earlier than normal this year. Normal high water time for the river is around the second week in April. Even today, however, the river is carrying plenty of water: the discharge rate this morning is 27,900cfs (cubic feet per second) whereas the normal discharge for 6 April is about 6,250cfs. For comparison, discharge for the river at flood stage a couple of weeks ago was around 62,000cfs!
The above map prepared by the Midwestern Regional Climate Center at the U of Illinois shows the temperature anomalies (departures from normal) for March in the Upper Midwest and you'll note that all of MN was above normal for March. Northeastern MN was 10 to 11 degrees above normal and much of south central MN (Arb Country!) was between 4 and 5 degrees above normal.
A companion map showing precip anomalies over the Upper Midwest seems not to be correct indicating much more precip than I think we had so I'm not including it here. As a substitute, here's a map of total March snowfall and it shows the VERY unusual case of no snowfall in MN. Isn't that remarkable?!
On the other hand, we had plenty of snow cover this winter that lingered into March and here's the DNR's map documenting that.
The map shows 15-18 inches of snow in Nicollet Co and measurements from our yard in St. Peter indicated 17-18 inches. You'll no doubt agree that if we'd received our normal March snowfall, between 10 and 12 inches, flooding of the MN River would have been much more serious.
For a more detailed summary of Minnesota's climate conditions and the resulting impact on water resources in March, please visit http://climate.umn.edu/doc/journal/hc1004.htm.
Here's a series of photographs from the Arb this past winter, taken by Arboretum Naturalist Bob Dunlap.
Crabapples coated in "hoar frost" in front of Interpretive Center, 12 Jan. 2010
Overwintering American Robin feeding on crabapples in Arb, 19 Jan. 2010
Gray Squirrel feeding on fallen seeds behind Interpretive Center, 28 Jan. 2010
Looking west from Interpretive Center, late afternoon 10 Feb. 2010
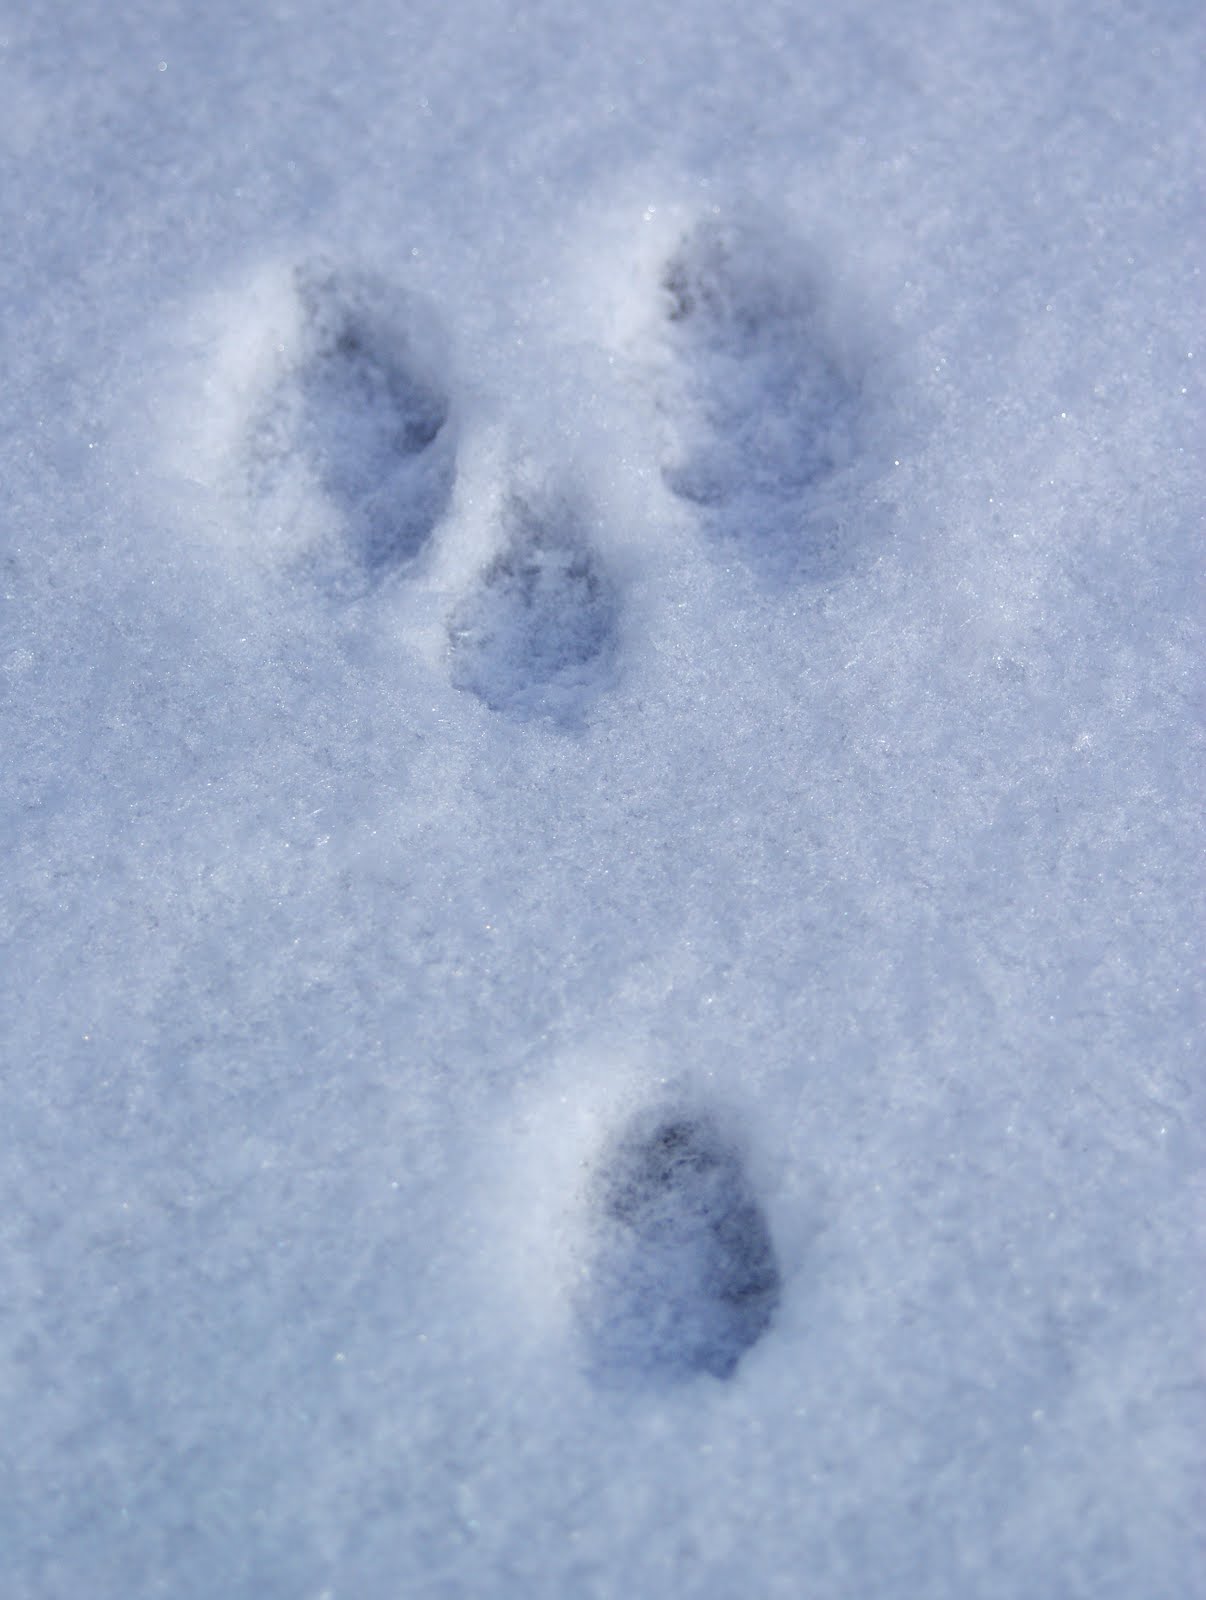
Eastern Cottontail tracks near Jones Northern Forest Ponds, 25 Feb. 2010
Cedar Waxwing feeding on (fermented) crabapples in front of Interpretive Center, 4 Mar. 2010
"Lake Linnaeus" temporarily occupying Interpretive Center parking lot, 11 Mar. 2010
Magnolia buds in front of Interpretive Center, 17 Mar. 2010
Bob Moline