Friday, November 5, 2010

November 2010


The above graph shows a trace of the gage heights of the Minnesota River before, during and after the recent flood event in late September. Note that the river at Mankato was above flood stage for about 9 days, producing damage to roads and some buildings.

The following graph shows streamflow in cubic feet per second (cfs) during the same period.  The small brown triangles show what the normal discharge is for these same days of late September and early October.  The peak flood discharge was over 80,000cfs; the normal discharge for those days is about 800cfs.  That is amazing!  The normal discharge indicates that this time of the year is the low water period of the river -- but certainly not this year!


The following map shows that the highest precipitation occurred in an east/west strip over the I=90 corridor with very substantial rains (9-10 inches) in the Mankato/St. Peter area.


And finally, next is a map of the percent of mean rainfall for the month; you can see that we received over 300% of the normal precip for the month. Again, really remarkable!


In early October a controlled burn of the 7-acre Uhler Prairie was conducted by the St. Peter Fire Department. It had been eight years since this prairie was last burned, and thus it was well overdue for a scorching. Fires are essential to a prairie for three reasons: (1) they remove dead and decaying material, (2) they release stored nutrients into the ground and encourage new growth, and (3) they keep trees and other woody plants from spreading into grasslands. Without fires, prairies have a difficult time thriving in the long run. The original native prairies (pre-settlement) were usually started by lightning strikes, but restored prairies are now burned periodically by the various agencies, organizations, and municipalities that manage them. What remains after Sunday’s burn looks and smells like a charred, ashen field, but don’t be discouraged; next spring the prairie will bounce back and appear greener than it has in years. The following is a series of photos from during and after the event.

Uhler Prairie Burn, 10/3/10. Photo by Herb Chilstrom.


Uhler Prairie Burn, 10/3/10. Photo by Herb Chilstrom.
Uhler Prairie Burn, 10/3/10. Photo by Herb Chilstrom. 
Uhler Prairie Burn, 10/3/10. Photo by Herb Chilstrom.
Uhler Prairie the day after the burn, 10/4/10. Photo by Bob Dunlap.
Bob Moline

Tuesday, April 6, 2010

March 2010

This graph shows the gauge height (measured or calculated by the U.S. Geological Survey) for the Minnesota River at Mankato during the high water period this spring.  You can see that the MN River was above flood stage at Mankato from late 18 March through late 28 March.  MN Highway 22 remained open through this period but MN 99, the road that crosses the river close to the Whiskey River Restaurant, was closed at the bridge for a while.  Water never covered the highway but came very close to the structural beams under the road that support the bridge so MNDOT decided it was best to close the bridge.  MN 99 has reopened now, of course.

March was warmer than usual this spring so the serious snowmelt period occurred earlier than normal this year.  Normal high water time for the river is around the second week in April. Even today, however, the river is carrying plenty of water:  the discharge rate this morning is 27,900cfs (cubic feet per second) whereas the normal discharge for 6 April is about 6,250cfs.  For comparison, discharge for the river at flood stage a couple of weeks ago was around 62,000cfs!

The above map prepared by the Midwestern Regional Climate Center at the U of Illinois shows the temperature anomalies (departures from normal) for March in the Upper Midwest and you'll note that all of MN was above normal for March.  Northeastern MN was 10 to 11 degrees above normal and much of south central MN (Arb Country!) was between 4 and 5 degrees above normal.

A companion map showing precip anomalies over the Upper Midwest seems not to be correct indicating much more precip than I think we had so I'm not including it here.  As a substitute, here's a map of total  March snowfall and it shows the VERY unusual case of no snowfall in MN.  Isn't that remarkable?!


On the other hand, we had plenty of snow cover this winter that lingered into March and here's the DNR's map documenting that.  The map shows 15-18 inches of snow in Nicollet Co and measurements from our yard in St. Peter indicated 17-18 inches.  You'll no doubt agree that if we'd received our normal March snowfall, between 10 and 12 inches, flooding of the MN River would have been much more serious.

For a more detailed summary of Minnesota's climate conditions and the resulting impact on water resources in March, please visit http://climate.umn.edu/doc/journal/hc1004.htm.

Here's a series of photographs from the Arb this past winter, taken by Arboretum Naturalist Bob Dunlap.

Crabapples coated in "hoar frost" in front of Interpretive Center, 12 Jan. 2010


 Overwintering American Robin feeding on crabapples in Arb, 19 Jan. 2010

 Gray Squirrel feeding on fallen seeds behind Interpretive Center, 28 Jan. 2010

 Looking west from Interpretive Center, late afternoon 10 Feb. 2010

 Eastern Cottontail tracks near Jones Northern Forest Ponds, 25 Feb. 2010

Cedar Waxwing feeding on (fermented) crabapples in front of Interpretive Center, 4 Mar. 2010

  "Lake Linnaeus" temporarily occupying Interpretive Center parking lot, 11 Mar. 2010

Magnolia buds in front of Interpretive Center, 17 Mar. 2010


Bob Moline

Tuesday, October 20, 2009

Fall 2009

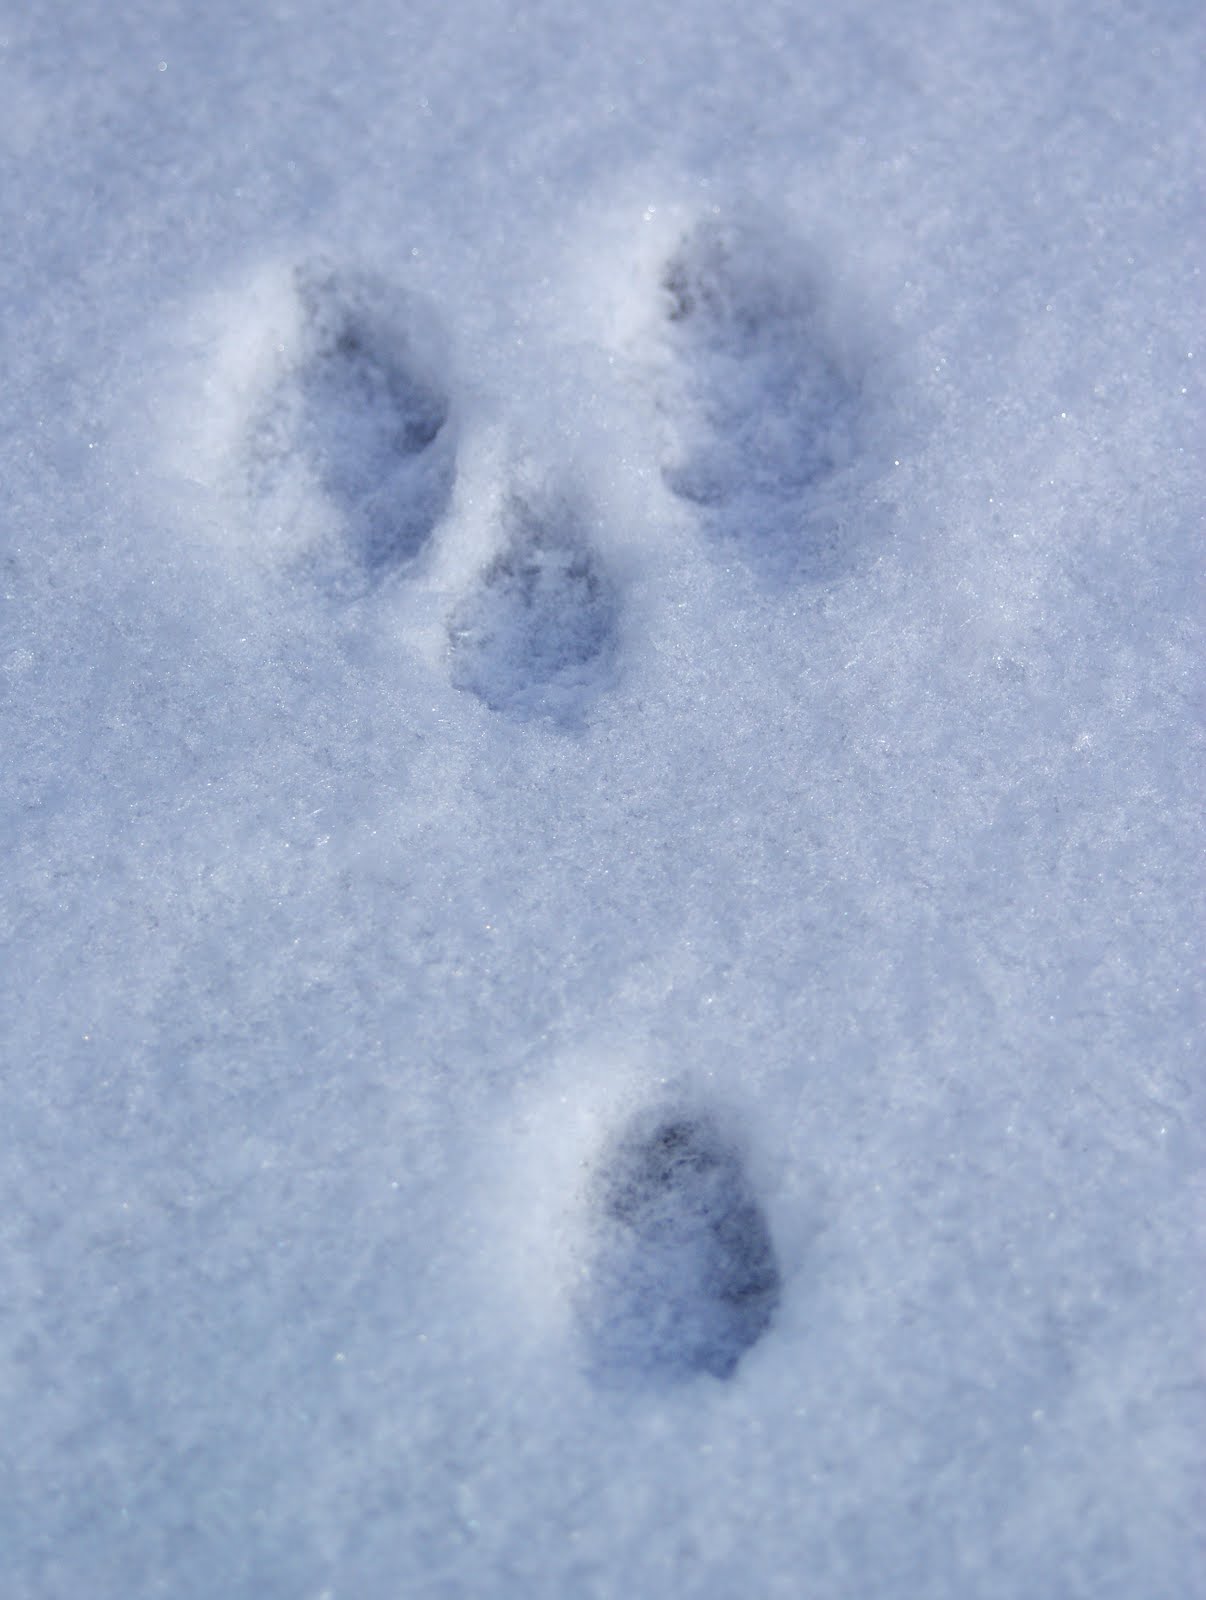
Here' s another issue of Prairie Smoke, focusing on some weather and climate maps showing how the fall season is progressing in the Arb. We are also including some wildlife photos and general scenes of the Arb.
These Minnesota DNR maps show the patterns of precipitation in inches during the week of 13-19 October and the percent of normal precipitation for the warm season so far -- 1 April through 19 Oct. As you can see, most of the eastern half of Nicollet County has received 80-90% of normal precipitation this summer.


This graph from the National Climatic Data Center of the National Weather Service shows the variation of September temperatures across the US for the last 114 years! The red line smooths out the yearly values that, as you can see, are usually strongly variable from year to year. Note the slow warming since the mid-1960s but also a little cooling of the Septembers over most of the last few years.


This one, similar in style to the one above, shows the temperature fluctuations during the summer months, June-August, again for 114 years. You can again see the slow warming since the 1960s with a dip in the mid-1990s and again during the last few years. Most scientists believe these cooling periods are temporary and do not signal an end to the overall global warming trend.

Climate Statistics for the Gustavus campus supplied by the weather station of the Department of Geography (http://homepages.gac.edu/~mbjellan/weather/).

Today, October 20
Avg. High Temperature: 61
Record High: 83 in 1950
Avg. Low Temperature: 36
Record Low: 11 in 1972
Record Rainfall : 1.26 in 1982
Record Snowfall : 0.00 on Missing
Sunrise: 07:37 AM
Moonrise: 10:36 AM
Sunset: 06:23 PM
Moonset: 07:27 PM
Monthly rain to date: 3.40
Year rain to date: 16.62
Average MRTD: 1.54 (MRTD = Monthly Rain to Date)
Average YTD: 26.55 (YTD = Year to Date)
+/- Month: +1.86
Water year rain to date: 16.62
+/- Year: -9.93#
Average YTD: 26.50

# Please note this deficit. We're nearly 10 inches below normal for the year even with the above normal precipitation for October thus far. This may help explain why the ponds in the Arb continue to look water deficient even with 1.86 inches of rainfall so far this October.


This final series of maps gives a set of outlooks from the National Weather Service. They're not called "Forecasts" but rather the NWS's Climate Prediction Center uses the more general term "Outlooks" as they show the probabilities of temperature and precipitation for both November and the three month period of November 2008-January 2009. Look at the November temperature outlook map, upper left. The darker color shadings represent higher probabilities of warmer-than-normal temps, NOT higher values of temperature itself. So Arizona, for example, has a 40% chance of having warmer-than-normal temps and the lighter shaded Nebraska on the same map means that there's just a 33-40% chance of being warmer-than-normal -- less likely to be warm than Arizona. Similar interpretation of the blue shading, representing cooler-than-normal temps.

Similar evaluations for the precipitation probabilities. Looks like much of California, for example, has at least 40% chance of being wetter than normal for the November-January period. Again, the darker the shading, the greater the chance of being wetter than normal. Tan color means a probability of drier than normal climate.

Large sections of these maps, as you've noted by now, show no color at all, only the letters "EC" which means "Equal Chances" -- equal chances of it being either colder or warmer than usual, wetter or drier than usual.

These maps are usually issued on the Friday of each month closest to the 15th of the month.

-----------------

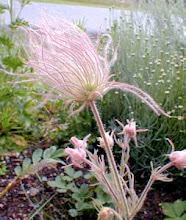
I'd like to end this post with a series of photographs from the Arb, taken this fall by Bob Dunlap, Arboretum Naturalist.

Red Admiral butterfly nectaring on marigold, 8 Sept. 2009


Bush Katydid camouflaged with Purple Coneflower leaf, 2 Sept. 2009


Northern Leopard Frog in Johnson Waterfall Garden, 2 Sept. 2009


Variegated Canna blooming in Evelyn Young Gardens, 3 Sept. 2009


New England Aster 'Alma Potschke' blooming in Bird and Butterfly Garden, 22 Sept. 2009


Melva Lind Interpretive Center, 29 Sept. 2009


Melva Lind Interpretive Center backyard, 12 Oct. 2009


Downy Woodpecker at suet feeder, 13 Oct. 2009


Blue Jay in Bird and Butterfly Garden, 13 Oct. 2009


Red-breasted Nuthatch at sunflower feeder, 13 Oct. 2009


Bob Moline

Thursday, July 23, 2009

Welcome

The Jim Gilbert Teaching Pond


Hey Friends of the Linnaeus Arboretum:

Welcome to this first edition of our new online newsletter, Prairie Smoke. We felt we needed to launch this for at least two reasons:
1. We think we should reach out to Friends more than we do with Twinflower four times/year. The plan is to publish Prairie Smoke three times/year -- February, July, and October.
2. We need to use color for photos and other illustrations and we can do this electronically MUCH less expensively than with the standard print format.

Prairie Smoke
takes its name from the flower of the same name found in the Arboretum. Note the photo to the left, but for a better picture please see the June photo in Anders Bjorling's 2009 Linnaeus Arboretum Calendar.

A view of the beautiful north side landscape of the David and Delores Johnson Waterfall Garden. The water area is on the other side of the rock garden.


A signature view of the Waterfall Garden.


And a side view.


Note the rich variety of flowering plants in the established Uhler Prairie. Orange flowers left and front center: Butterfly Weed, yellow flowers right: Heliopsis sp. (wild sunflower). This prairie covers about an acre of land in the Arb and offers a wondrous taste of a prairie landscape, but in about 5 years. . . .


. . . .you'll be able to look at 70 acres of these plants, which are just getting started in our new Coneflower Prairie shown here.


I'm sure you realize that the summer so far has been drier than normal over much of southern Minnesota. This map from the Minnesota Department of Natural Resources (DNR) confirms your observations and illustrates the geography of the warm season precipitation over the state this year. The orange/tan color in the St. Peter area indicates that just 50-60% of the normal precipitation has fallen since 1 April.

Arb plants are under some stress because of this deficit but it's the drastic shrinking of the wetlands and ponds in the Arb that give the best indication of our area's below normal precipitation.


Bob Moline
Prairie Smoke Editor (this time!) with much help from Arboretum Naturalist Bob Dunlap